The 2020 Battle for Congress: A Story Through Two Years of Rating Changes
November 2, 2020 · 1:53 PM EST
Election Day is this Tuesday, and while it might seem like an eternity since the midterms, it’s only been two years since Americans last went to the polls to elect their members of Congress.
In this article, we’re taking a look back at the last 20 or so months and how our outlook on the fight for Congress has shifted over that time. While the final set of ratings are important, there is still a larger story to be told about how the fight for Congress has played out over the past two years. (You can click any image to enlarge it.)
The Senate
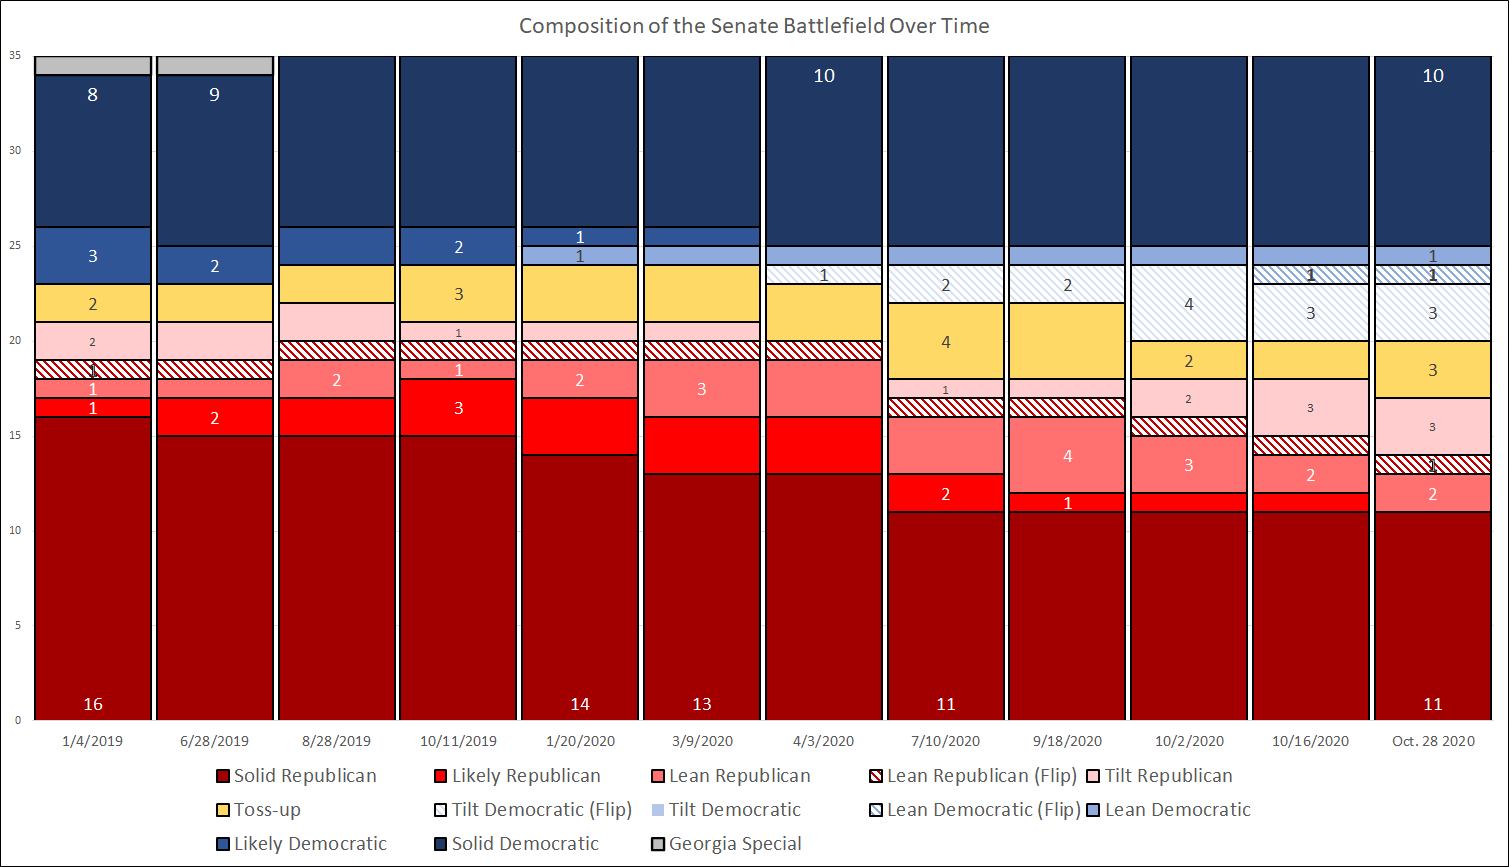
Our first Senate ratings came out on January 4, 2019. In the 22 months since then, we have made 30 shifts to 15 races (out of 35 total). Of the 30, all but three were in favor of Democrats. As a result, although Democrats were not favored in any GOP-held seats in January 2019, they are now favored in four, and have better chances in 10 additional seats than they did at the outset of the cycle.
The shifts tell a larger political story of the past two years: Democrats have not only capitalized on the opportunities apparent at the beginning of the cycle in Arizona, Colorado, North Carolina, and Maine, but they have also expanded the battlefield deep into Republican territory. Five seats we initially rated as Solid Republican eventually moved out of that category, with one ending up in Toss-up, two in Tilt Republican, and two in Lean Republican.
Even in 2019, we wrote that Democrats had a well-defined path to retaking control of the Senate. But the events of 2020 — Joe Biden’s victory in the Democratic primary, and President Trump’s poorly received response to the tripartite crises of coronavirus, recession, and racial strife — have caused the president’s numbers to slump to such a degree that Democrats now have multiple paths to the majority, including via pickups in traditionally red states such as Kansas, South Carolina, and Texas.
Despite the dramatic, historic, and unpredictable nature of the past two years, the political winds largely blew in one direction. The last shift in Republicans’ direction came on January 10, 2020, when we moved Michigan (Peters, D) out of Likely Democratic and into Lean Democratic, where it remains today. Since then, we made 21 shifts in Democrats’ favor.
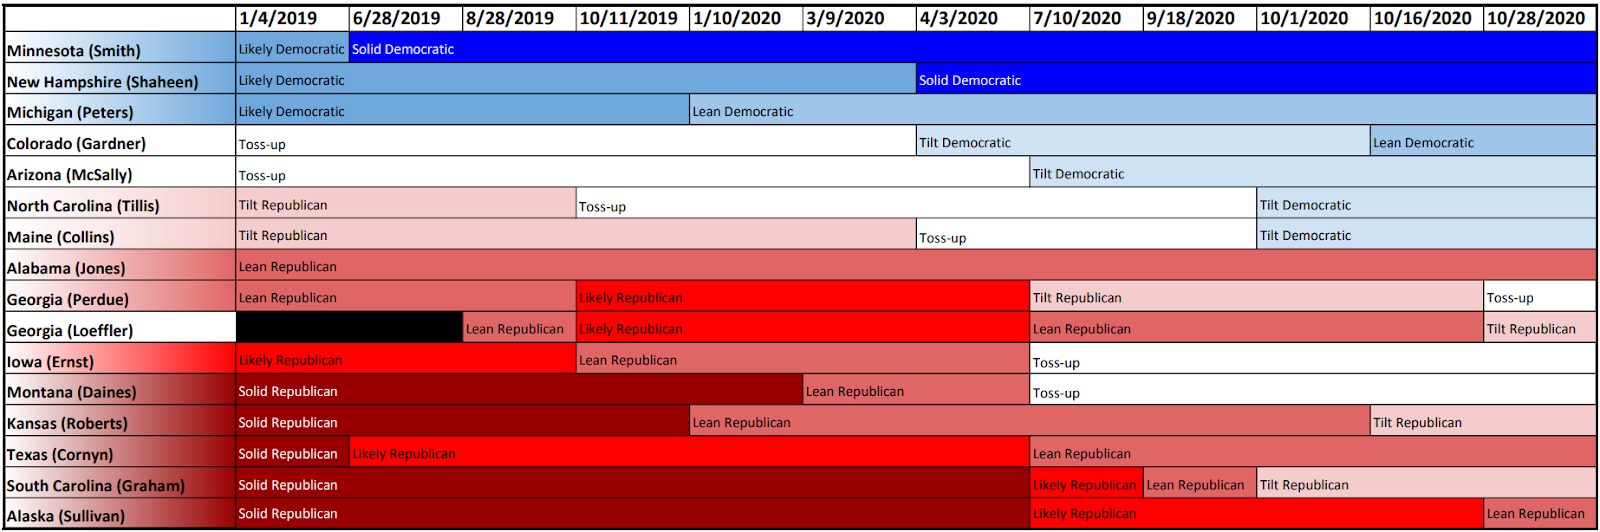
Though there were 35 Senate races this cycle — 33 Class II seats and 2 special elections — 20 races never saw their ratings changed. There is often a tendency to react to the news of the day as if it is the most earth shattering set of events. But the relative paucity of ratings shifts, and the immobility of a majority of the field, is a useful reminder that things don’t always change as much as we think they do, and that you can tell a lot about an election, even one two years out, just by looking at the state’s previous behavior.
Biggest mover: The most times any race was moved was three, as was the case with both Georgia seats and South Carolina.
The race that moved the farthest was Montana, which began as a Solid Republican but became more competitive when Gov. Steve Bullock decided to run, eventually ending as a toss-up.
Only one race not rated Solid has remained unmoved. In Alabama, Democrat Doug Jones was and remains a serious underdog in his race for a full term in the Yellowhammer State, and has sat at Lean Republican since January 2019.
The House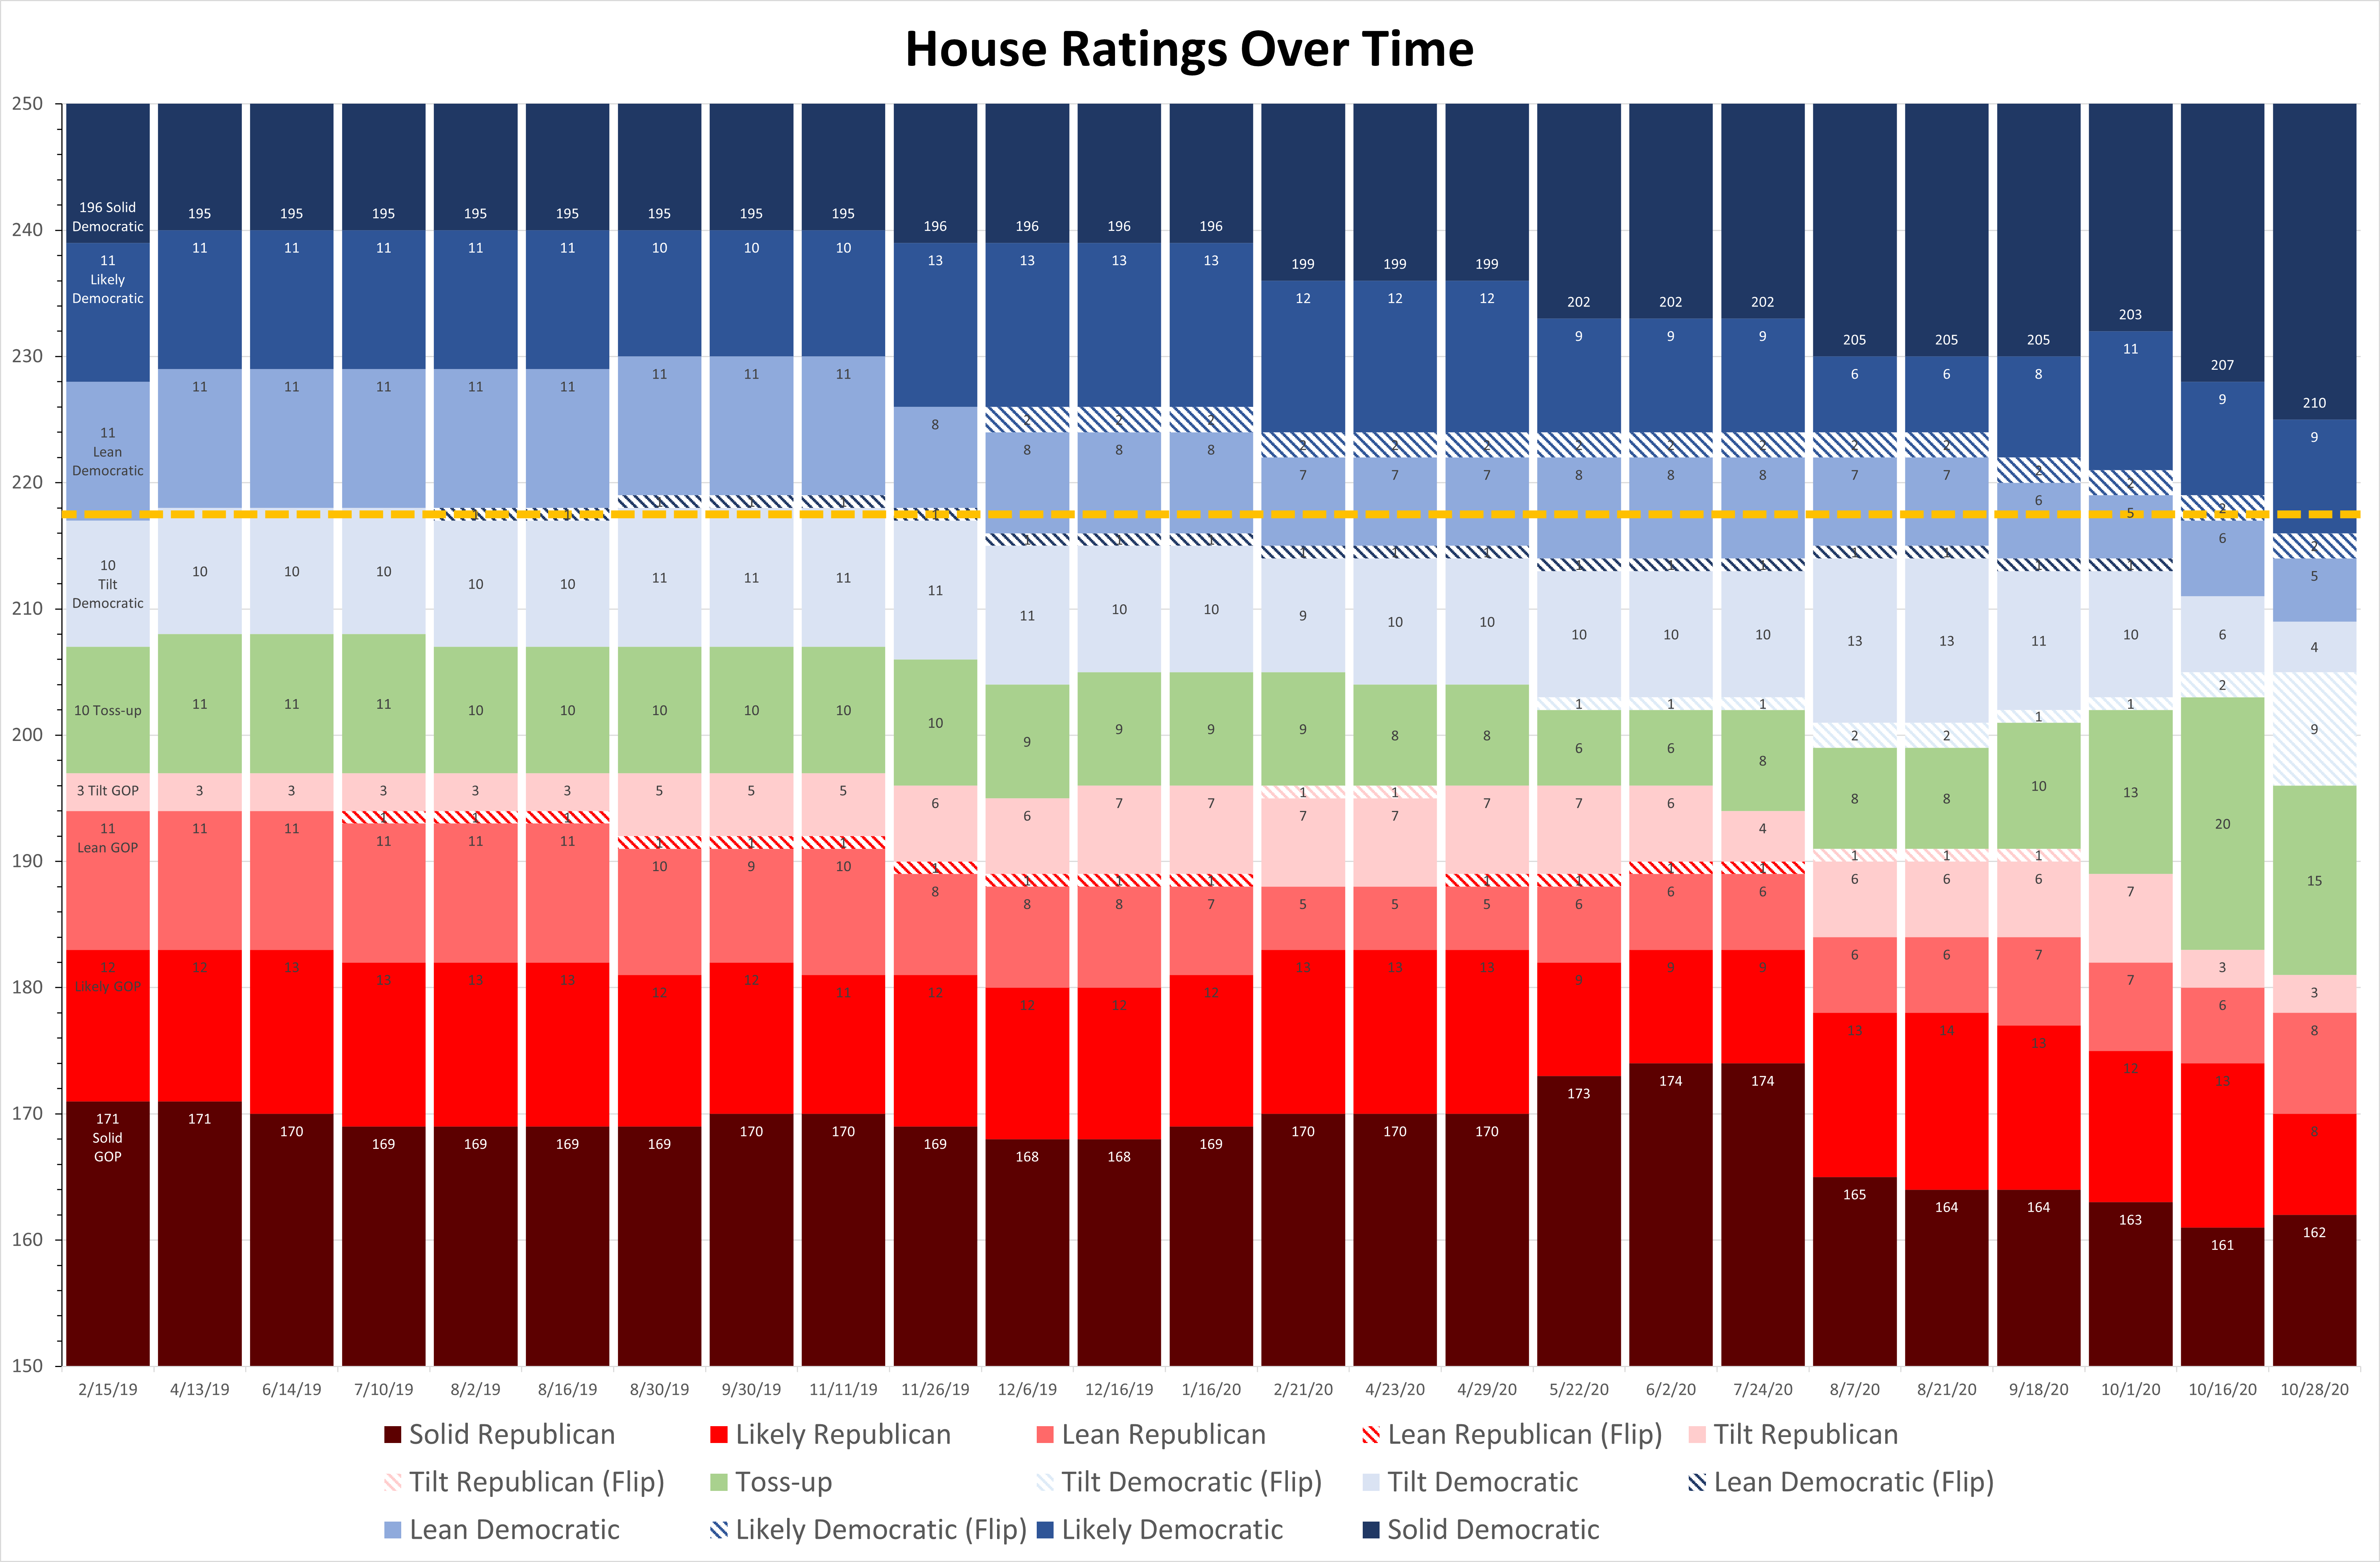
Unlike in the battle for control of the Senate, which has only grown more competitive over the course of the election cycle, there was never much doubt that Democrats would retain their majority in the House of Representatives.
Over the course of 20 months and 24 sets of ratings changes — some encompassing just one seat, others involving more than two dozen shifts — we can see that Democrats have only solidified their standing in the chamber.
The graph below documents how each of those 24 sets of shifts altered the House landscape. Because most House seats are Solid and never move, the graph is bound on the y-axis between 150 and 250 seats, to better show the changes in the ratings. The yellow line notes the threshold for a majority.
From the outset, Democrats were favorites to maintain control. In our first set of ratings, on February 15, 2019, we gave Democrats the advantage in 228 seats, and the Republicans the advantage in 197, with 10 Toss-ups. With 218 seats necessary for a majority, that meant that even if Republicans won all Toss-ups and all Tilt Democratic races, Democrats would still retain the majority, albeit by the narrowest-possible margin.
As the cycle progressed, Democrats consolidated much of their 2018 gains, and began to push into Republican territory, gradually expanding the scope of competitive races. As a result, the number of Solid Democratic seats grew from 196 to 210, while the number of Solid Republican seats fell from 171 to 162.
In our final ratings, on October 28, 2020, we found Democrats favored in 239 races, Republicans favored in 181 races, and 15 Toss-ups.
Although the number of seats where Democrats are favored increased, and the number of seats where Republican are favored decreased, the number of races rated Toss-up remained relatively stable for much of the cycle, before increasing sharply toward the end of the year.
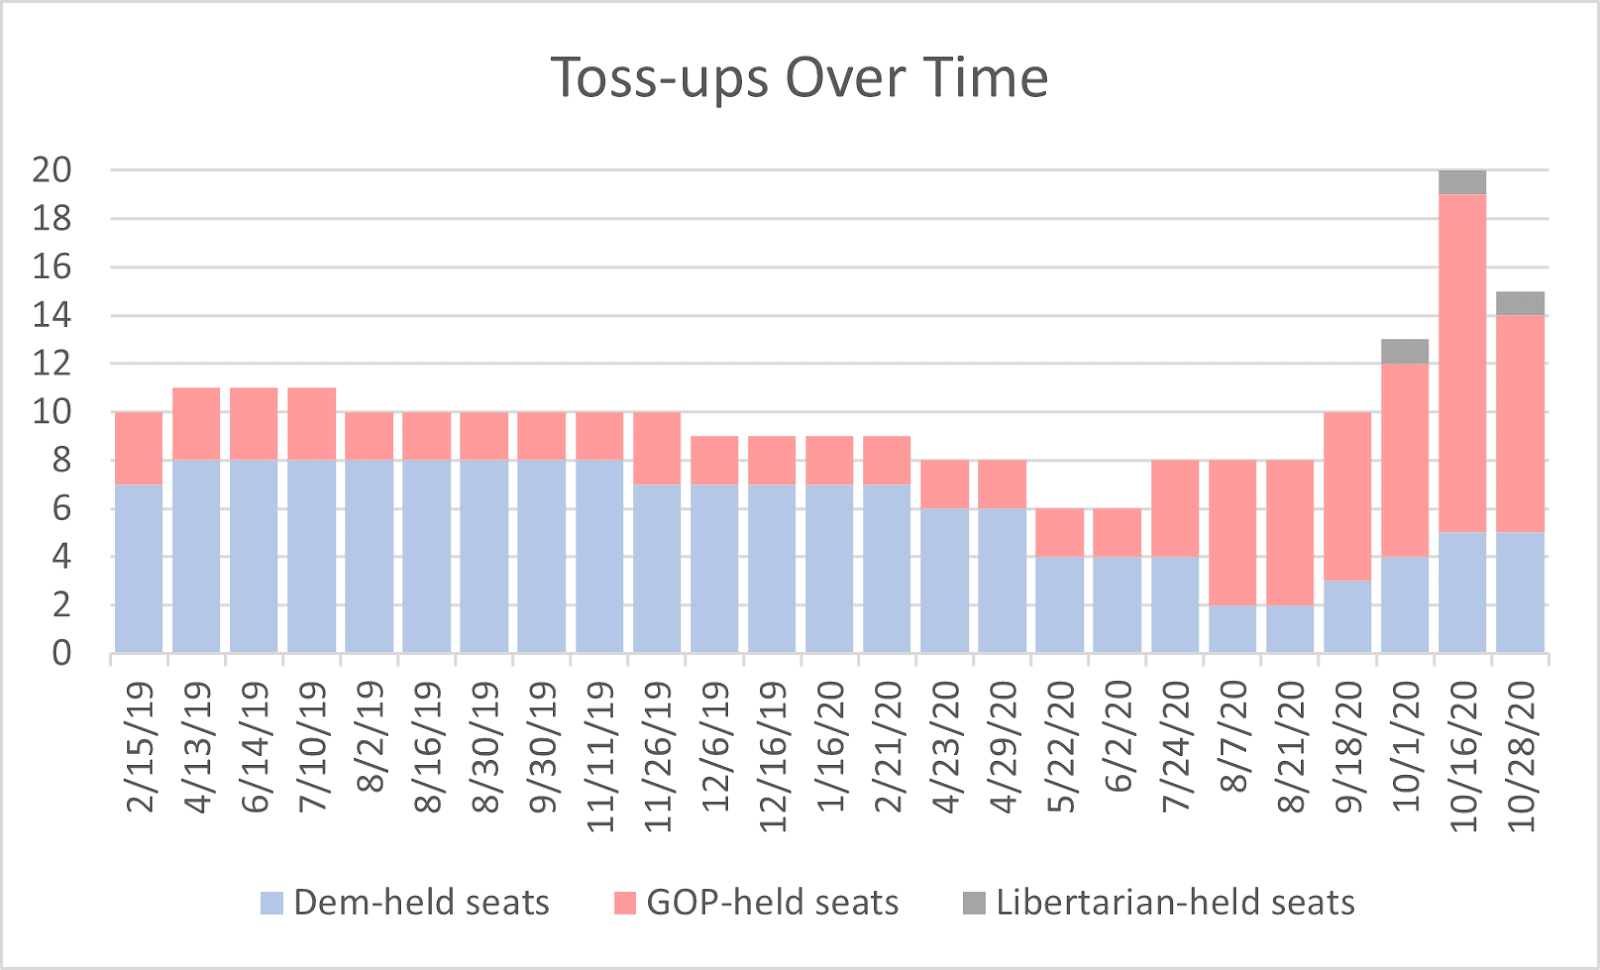
For most of the cycle, there were more Democratic-held seats in Toss-up than GOP-held seats. While Democrats have done a good job of solidifying their holds on many of the “Frontline” districts they flipped in 2018, some of them have remained vulnerable, and several have gotten more vulnerable over the course of the cycle.
Meanwhile, the number of Republican seats increases significantly in the second half of 2020, as the president’s slump in support made more and more GOP incumbents vulnerable. The drop in GOP-held Toss-ups in the final set of ratings is largely due to GOP-held seats moving to Tilt Democratic.
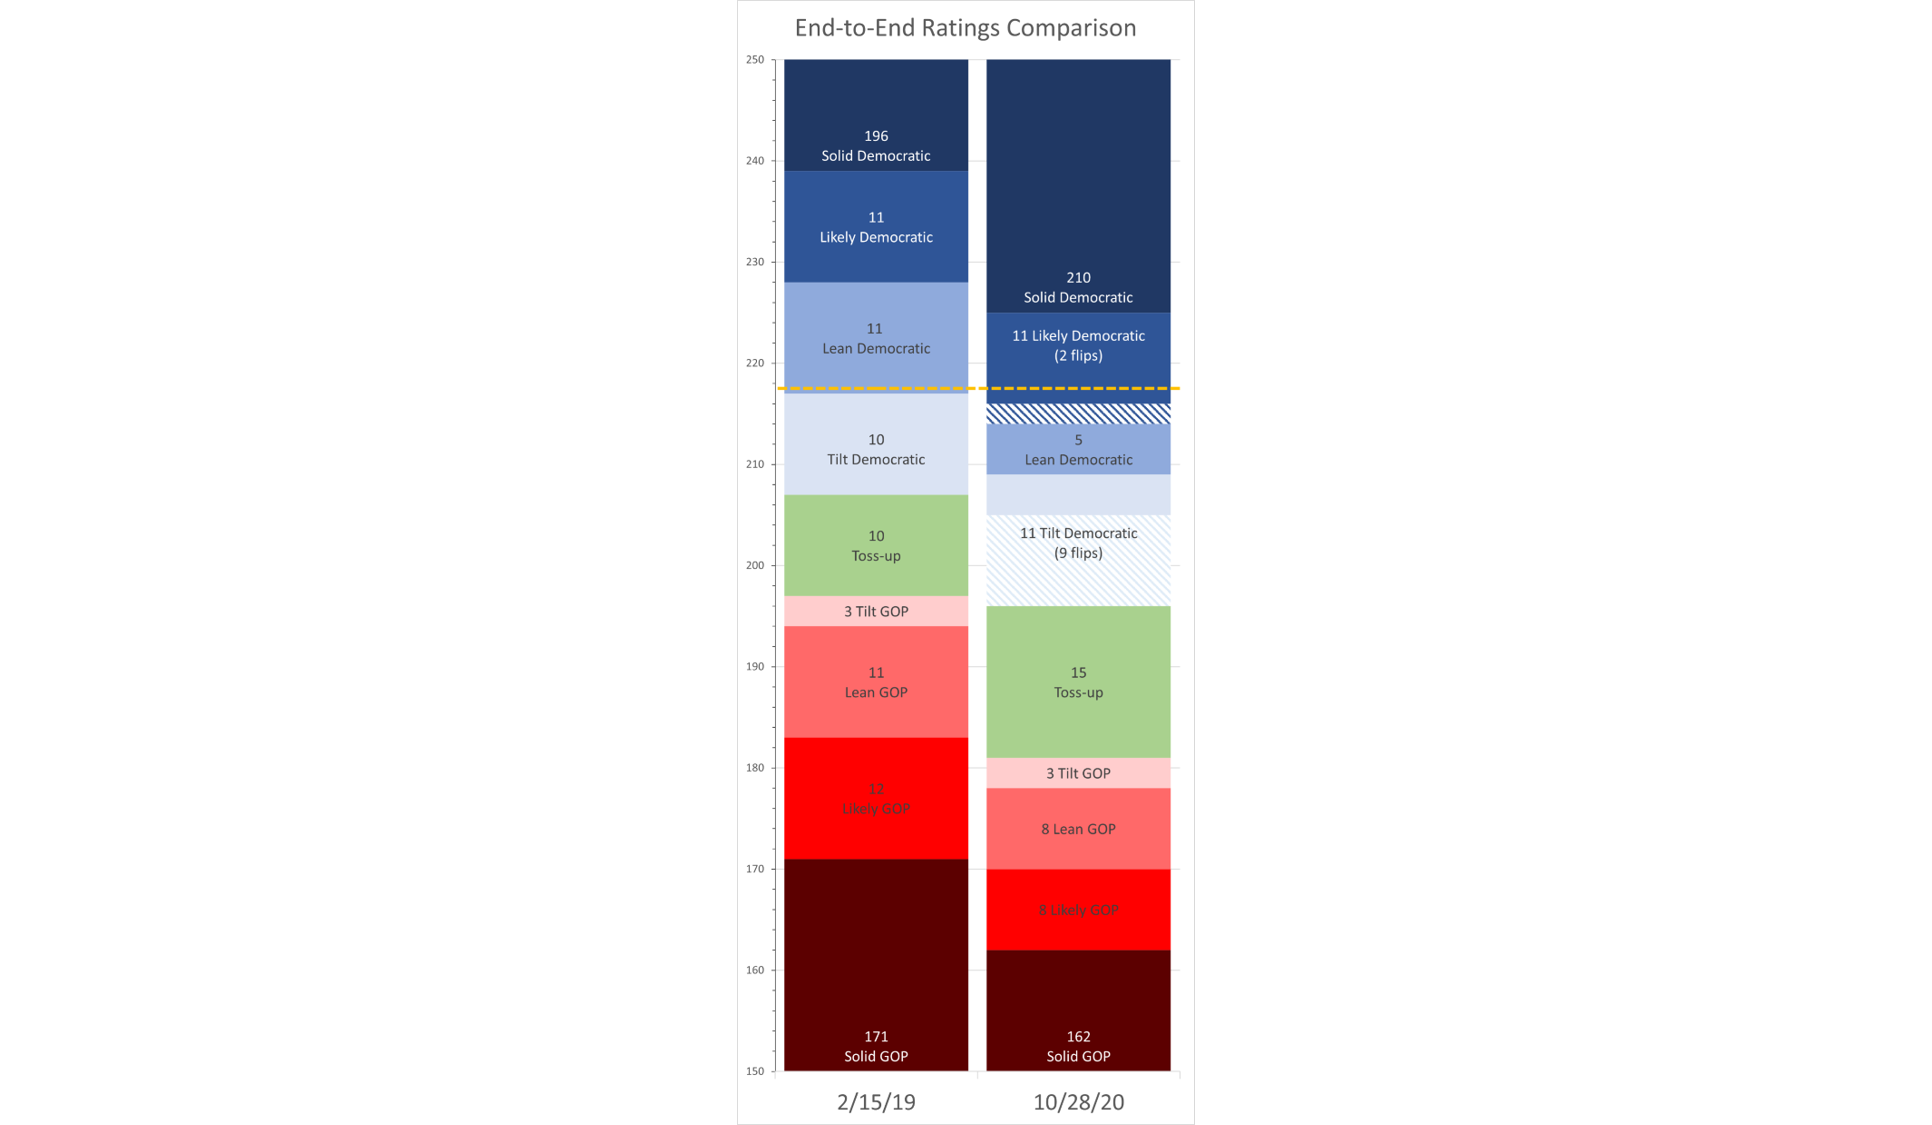
There is yet another way we can illustrate how Democrats’ position in the House has improved over the last 20 months: tracking where our original slate of races rated Toss-up or Tilt Democratic/Republican ended the cycle, and tracing where our final slate of Toss-up and Tilt Democratic/Republican races began the cycle.
These two charts show how the battlefield’s center of gravity has shifted toward Democrats since the beginning of 2019.
Of the 23 races initially rated as a toss-up or Tilt, just three have ended the cycle rated more favorably for Republicans: Pennsylvania’s 1st, New Mexico’s 2nd, and North Carolina’s 9th. (In the last case, the initial Toss-up rating was assigned because of the uncertainty surrounding the 2018 outcome in the district, which was not resolved until September 2019.)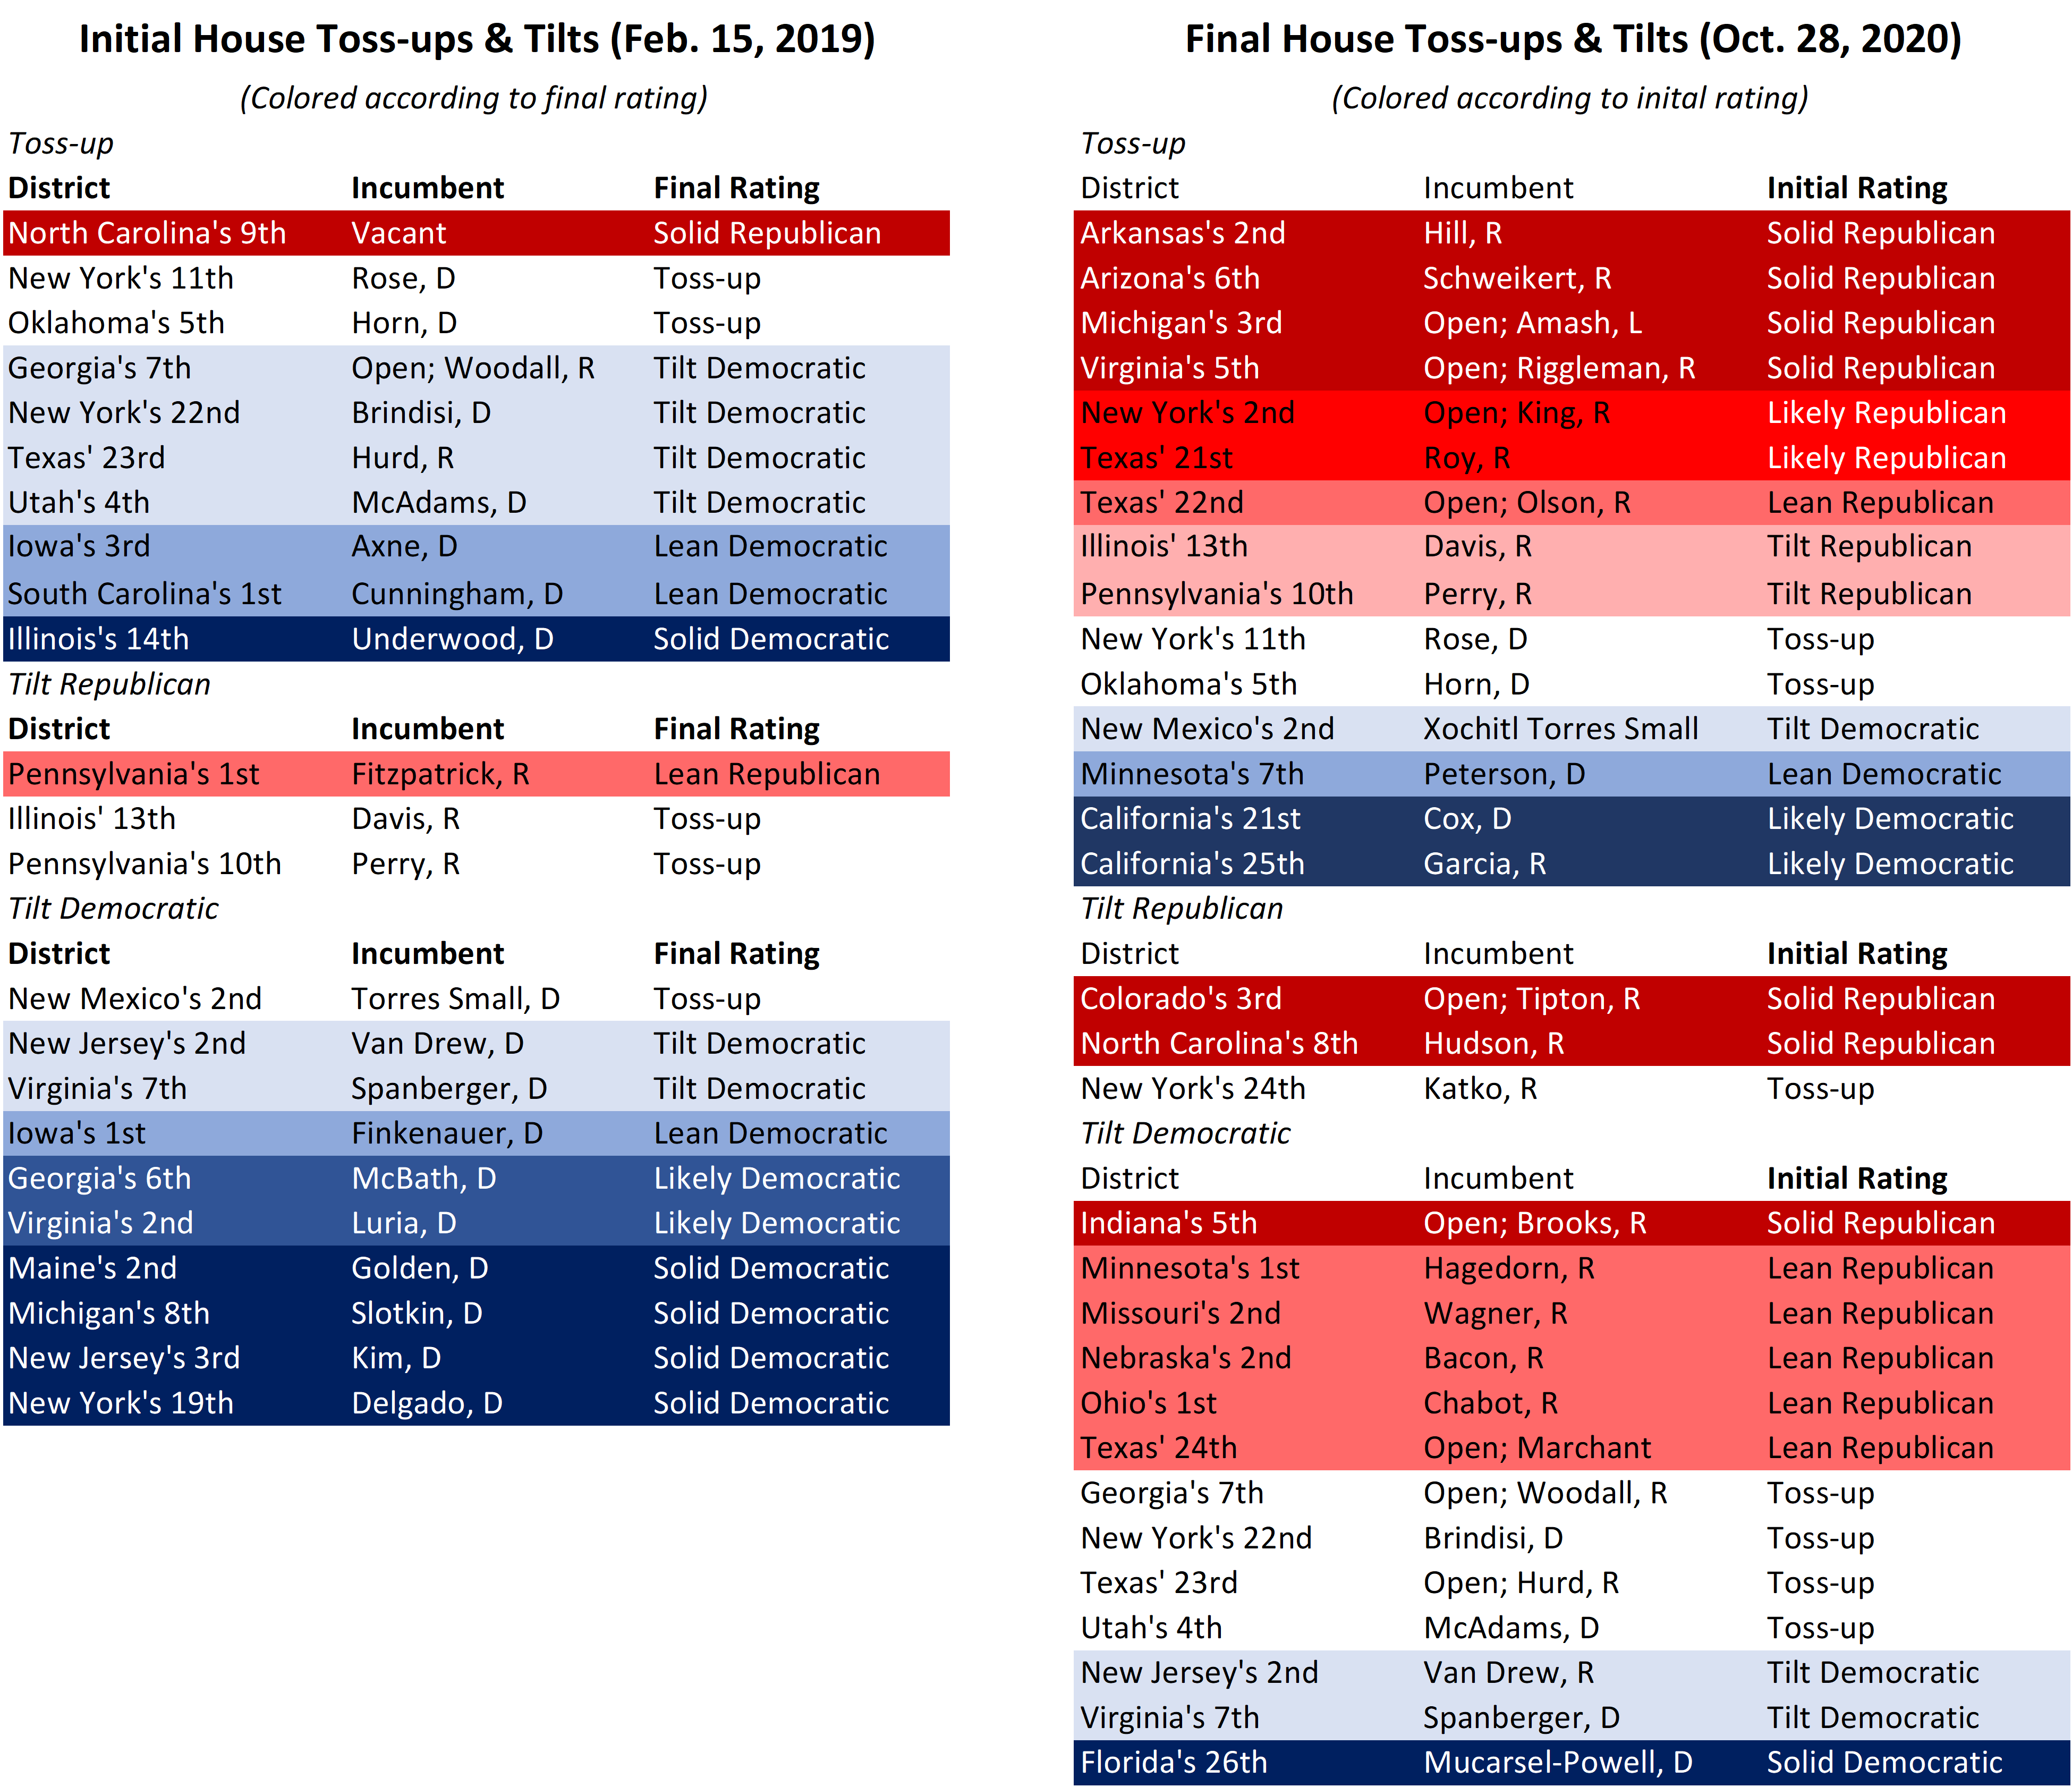
Meanwhile, 14 seats moved overall toward Democrats, including five to Solid Democratic.
Tracing the final set of Toss-up and Tilt races reveals a similar picture. Of the 31 races that ended with a Toss-up or Tilt rating, 21 of them had previously been rated more favorably toward Republicans, six toward Democrats, and four remained at their initial rating throughout.
Taken together, the charts show how Democrats both locked down much of their own vulnerable territory, while aggressively moving into deeply Republican districts.
Biggest Movers: The one district that moved the furthest since our initial ratings is Indiana’s 5th District, which began the cycle at Solid Republican, and ends it at Tilt Democratic. The reason is threefold, and reflective of the GOP’s larger struggles this cycle. First, Rep. Susan Brooks chose to retire, one of 26 Republicans to do so. Second, Republicans failed to land a top-tier candidate, instead landing on polarizing state Sen. Victoria Spartz, who self-funded her way to victory in a crowded primary. Finally, President Trump’s collapse in the suburbs makes districts such as this one newly competitive for Democrats, who nominated a solid candidate in former state Rep. Christina Hale. Covering the second-most ground was Rep. Lauren Underwood in Illinois’ 14th District, who began the cycle in Toss-up but ended in Solid Democratic.
While most districts only moved in one direction, several took more circuitous paths, most notably Michigan’s 3rd. That district began at Solid Republican, then moved to Lean Republican when Rep. Justin Amash announced he would run for re-election as an independent, eventually moving further to Tilt Republican, before moving back to Lean Republican after Amash announced he would not seek re-election at all, and them back to Tilt Republican as the summer progressed. Eventually it landed at Toss-up, as it became clear Trump might not win the district as he did four years ago
In Conclusion…
It (hopefully) won’t be long before we know who won all these races and receive a final grade on our ratings. It also won’t be long after that before we turn an eye toward the 2022 midterms.
But even if each individual rating doesn’t match up with the result, the evolution of our ratings, from January 2019 to October 2020, tells the story of the battle for the House and Senate as it played out over the past two years.