The 6,670-Vote Majority: How Republicans Barely Won the House
December 13, 2022 · 12:35 PM EST
Heading into the 2022 midterms, Republicans were confident that a Red Wave would sweep them back into power in Congress.
Ultimately, not only did a Red Wave fail to materialize, but Republicans barely cleared the lowest of bars they had set for themselves at the beginning of the cycle: winning back the House of Representatives.
The GOP needed a net gain of five seats to win back the majority. While the party did net nine seats, in the five closest GOP wins in the country, the victorious Republican candidates outpaced their Democratic opponents by a combined 6,670 votes.
With 107,381,703 total votes cast in 2022 House elections (according to data from The Cook Political Report with Amy Walter as of Dec. 7, 2022), that means Republicans won the House majority by just 0.006 percent of the House popular vote — despite winning the nationwide vote by 2.8 percent.
The president’s party usually suffers significant House losses in midterm elections — 30 seats on average over the last century.
While Republicans did underperform expectations by only picking up nine seats, this midterm still fits within the broader historical trend of the president’s party losing House seats, something that has happened in 23 of the last 26 midterm elections.
But even that didn’t come easily. The GOP came just 22,378 votes away from failing to net any seats at all. That’s the combined raw vote margin of Republicans’ nine closest victories.
Fast Five
The five closest races won by Republicans were Colorado’s 3rd (554 votes), California’s 13th (584 votes), Michigan’s 10th (1,600 votes), New York’s 17th (1,787 votes), and Iowa’s 3rd (2,145 votes).
Three of those five — California’s 13th, New York’s 17th, and Iowa’s 3rd — were seen as highly competitive heading into election day. Inside Elections rated them as either Toss-up or Tilt Republican, and they attracted a combined $25 million in outside TV spending from the main party super PACs.
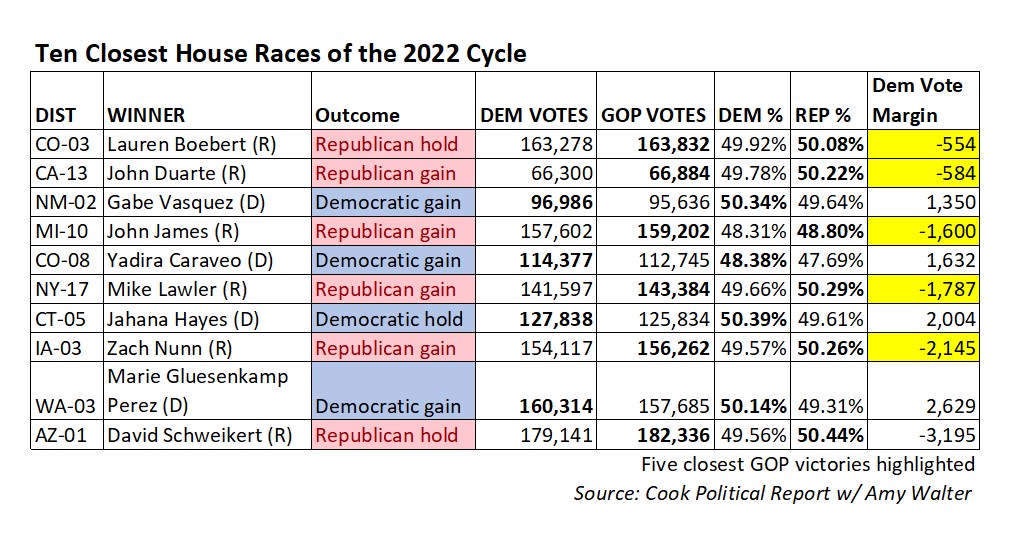
But the other two, Colorado’s 3rd and Michigan’s 10th, were not seen as particularly competitive. In Michigan, Republican John James was one of Republicans’ top recruits and best fundraisers, while the Democratic nominee, Carl Marlinga, had some personal baggage and couldn’t get the time of day from party leadership in D.C. In Colorado, Lauren Boebert’s district had been redrawn to be even more Republican-leaning.
While Republicans spent big on James throughout the cycle, Democrats did not support Marlinga, and neither party put resources into Colorado’s 3rd.
If there’s a common thread between the two races, it’s that candidate quality still matters — up to a point. James was a strong candidate for Republicans, and Marlinga a weak one for Democrats. That helped James outrun the statewide GOP candidates on the ballot, all of whom lost the district, but wasn’t enough to ensure a comfortable win.
And Boebert’s penchant for courting controversy gave her some unique vulnerabilities as a candidate, which meant she underperformed all but one statewide GOP nominee in her district — but not by enough to lose her race.
Missed Opportunities
Colorado’s 3rd and Michigan’s 10th are the two clearest missed opportunities for national Democrats, who stayed out of both races entirely only to lose both by a combined 2,154 votes.
Most of the other closest races were heavily contested by both parties, such as New Mexico’s 2nd District, Colorado’s 8th District, New York’s 22nd District and Pennsylvania’s 7th District.
But a few districts where the margin was under 5 percent stand out for the lack of national involvement from one or both parties.
Arizona’s 1st District, ultimately the 10th-closest race in the country, flew under the radar until the closing weeks of the race, when House Majority PAC began a last-minute ad buy against GOP Rep. Dave Schweikert, who ultimately won by just 3,195 votes (0.88 percent). And Arizona’s 6th District, the 12th-closest race in the country, attracted virtually no investment from national Democratic groups while the National Republican Congressional Committee and GOP super PAC Congressional Leadership Fund spent $4.4 million on TV boosting Juan Ciscomani, who ultimately won by 5,232 votes (1.2 percent).
Oregon’s 5th District, Montana’s 1st District and California’s 41st District also all stand out as contests that saw limited engagement from national Democratic groups. House Majority PAC did not spend in any of the three, which were decided by 2.1 percent, 3.2 percent, and 4.7 percent, respectively, and the Democratic Congressional Campaign Committee spent in only Oregon’s 5th out of the trio.
There were fewer close races won by Democrats that saw minimal GOP spending, “missed opportunities” for Republicans. That is, at least in part, a reflection of the GOP’s financial advantage this midterm cycle. CLF, the Kevin McCarthy-aligned super PAC, spent $50 million more on TV than HMP, the Nancy Pelosi-aligned group.
In North Carolina’s 1st District, GOP groups largely abandoned their nominee, Sandy Smith, because of her significant personal baggage including multiple accusations of domestic violence. Her Democratic opponent, Don Davis, won by just 4.7 percent in a seat that is trending Republican.
And in Florida’s 23rd District, which attracted no outside spending from either party, Democrat Jared Moskowitz won an unimpressive 4.8 percent victory over his GOP opponent, Joe Budd. Although Joe Biden carried the seat by 13 points in 2020, GOP Gov. Ron DeSantis actually won this district narrowly in 2022.
A Nailbiter
The historical narrowness of the incoming GOP majority becomes clear when comparing this cycle to previous elections over the past decade.
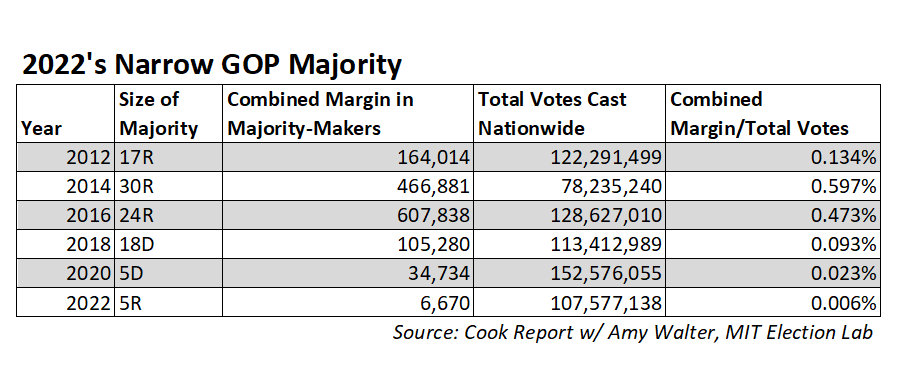
House Republicans won the majority by 6,670 votes, or 0.006 percent of the nationwide popular vote. Had Democrats won an additional 6,671 votes across five districts, they would have maintained their majority.
In 2020, Democrats won 222 seats. But their majority rested on the 34,734-vote combined margin of victory in their five closest victories. Those decisive votes were just 0.023 percent of the 152,576,055 ballots cast nationwide.
Democrats had a stronger performance in 2018, when they won their majority by 105,280 votes (the combined margins of victory in the 18 closest Democratic victories) — 0.093 percent of all votes cast that year.
And Republicans had much stronger years in 2016, winning the majority by 607,838 votes (the combined margins of their closest 24 victories) and in 2014 winning by 466,881 votes (the combined margin of their 30 closest victories).
In 2012, the GOP won their closest 17 races by a smaller but still robust combined margin of 164,014 votes.
A Return to Balance
In 2020, Democrats suffered unexpected losses in the House, a disappointing result that stung all the more because of the number of bad breaks in close races.
That year, Democrats lost eight of the 10 closest House races by absolute vote margin, including all seven of the closest races. This year, the 10 closest races split more evenly, with Republicans winning six and Democrats winning four.
Of the 35 races decided by less than 5 points in 2022, Republicans won 19 to Democrats’ 16. And of the 57 races decided by less than 10 points, Republicans won 31 to Democrats’ 26.
If anything, that relatively even split should be heartening for both parties and does not signal that one party narrowly escaped catastrophe.
That was the case in 2018, a wave year in which Democrats picked up 40 seats that nonetheless saw Republicans win six of the 10 closest House races, 23 of the 43 races with margins under 5 percent, and 48 of the 88 races with margins under 10 percent. The GOP escaped the possibility of much more severe losses that year — such as in Texas, which was home to three of the GOP’s ten closest wins.
And in 2014, Democrats lost 13 seats overall but won seven of the 10 closest races, 14 of the 22 races decided by 5 points or less, and a whopping 31 of the 45 races decided by 10 points or less. That year, the heavy presence of Democrats on the close race list suggests the party came close to a more substantial wipeout.
From 2018 through 2022, there has been remarkable consistency in the number of close congressional races. However, there have been significantly more close races in the latter half of the past decade compared to the 2012, 2014, and 2016 cycles.
![]()
The Bottom Line
Biennial congressional elections are national events, but they are ultimately decided at a much more local level. A few thousand votes across a few districts can have massive ramifications for the balance of power in Washington, DC, and even the future of the country.
While most of the closest races were expected to be competitive, there were some surprises. It’s a good reminder that, despite the large and growing amount of resources, attention and energy devoted to the fight for Congress — from candidates, parties, and interested outside players and observers — it’s impossible to predict every outcome in a country as big and varied as ours.
Not only did a “red wave” not materialize for House Republicans, but their new majority rests on the narrowest victory in over a decade, setting up the fight for the House as the marquee congressional battle of 2024.