TV Ads Shape Presidential Battleground
July 20, 2020 · 11:51 AM EDT
While much of what happens during a presidential race is hidden these days, the campaigns can’t hide their TV buys. Now, a few months into the general election, the advertising reveals volumes about campaign strategies and resources.
Since April 1, a reasonable start date to the Trump-Biden contest, $214 million has been spent on political advertising (local and national broadcast TV, local and national cable TV, radio, and digital) in the first 16 weeks of the general election. The data gathered by Kantar CMAG show that Trump and his allies have outspent Biden and his allies by $32 million ($122 million to $90). That would seem to poke a hole in the GOP argument that the president has yet to even attempt to define the former vice president and that the race will fundamentally change when he does.
Going forward, however, resources do not seem to be an issue. The Biden campaign recently reported strong fundraising numbers and most of the Trump/Republican advantage was generated out of the starting block with the gap narrowing in recent weeks. In fact, in the most recent week, the candidates and their allied outside groups spent an identical $11 million and orders on local television (cable and broadcast) for the coming week skew towards the Democrats by a margin of nearly three to one.
Local television (both broadcast and cable) has drawn the greatest share of advertising dollars (58 percent) with local broadcast spend alone comprising nearly half of all political advertising in the presidential contest. Both sides are dedicating large shares of their advertising budget to local broadcast television with Democrats spending a slightly greater share on local cable. When it comes to national advertising, something we expect to see a lot more of, Republicans are more likely to spend on national outlets, with Fox News the most attractive national platform for Republican ad buyers.
At this point, the Trump campaign is spending three out of four dollars on the GOP side of the scale. As the Biden campaign ramped up, groups on the Democratic side shouldered a greater load with half of spending by the candidate and half by all non-candidate outside groups, including super PACs. As Election Day nears and lowest unit rate rules come into play for campaigns, it will be important to monitor the ratio of candidate to group spend since candidate dollars purchase more spots within the 60 day window.
Recent national polls have shown Biden with a large and growing lead and if those numbers are accurate and hold, close states will not end up being decisive states. In other words, there are always close states no matter the national margin, but those “battleground" states will not decide the presidency. Accordingly, campaigns tend to target the states that would be decisive and would be decisive if the race hinges on a state or two. And, the geographic targeting of ads is of course a terrific window into how the campaigns view which states are decisive in the race to 270 Electoral College votes.
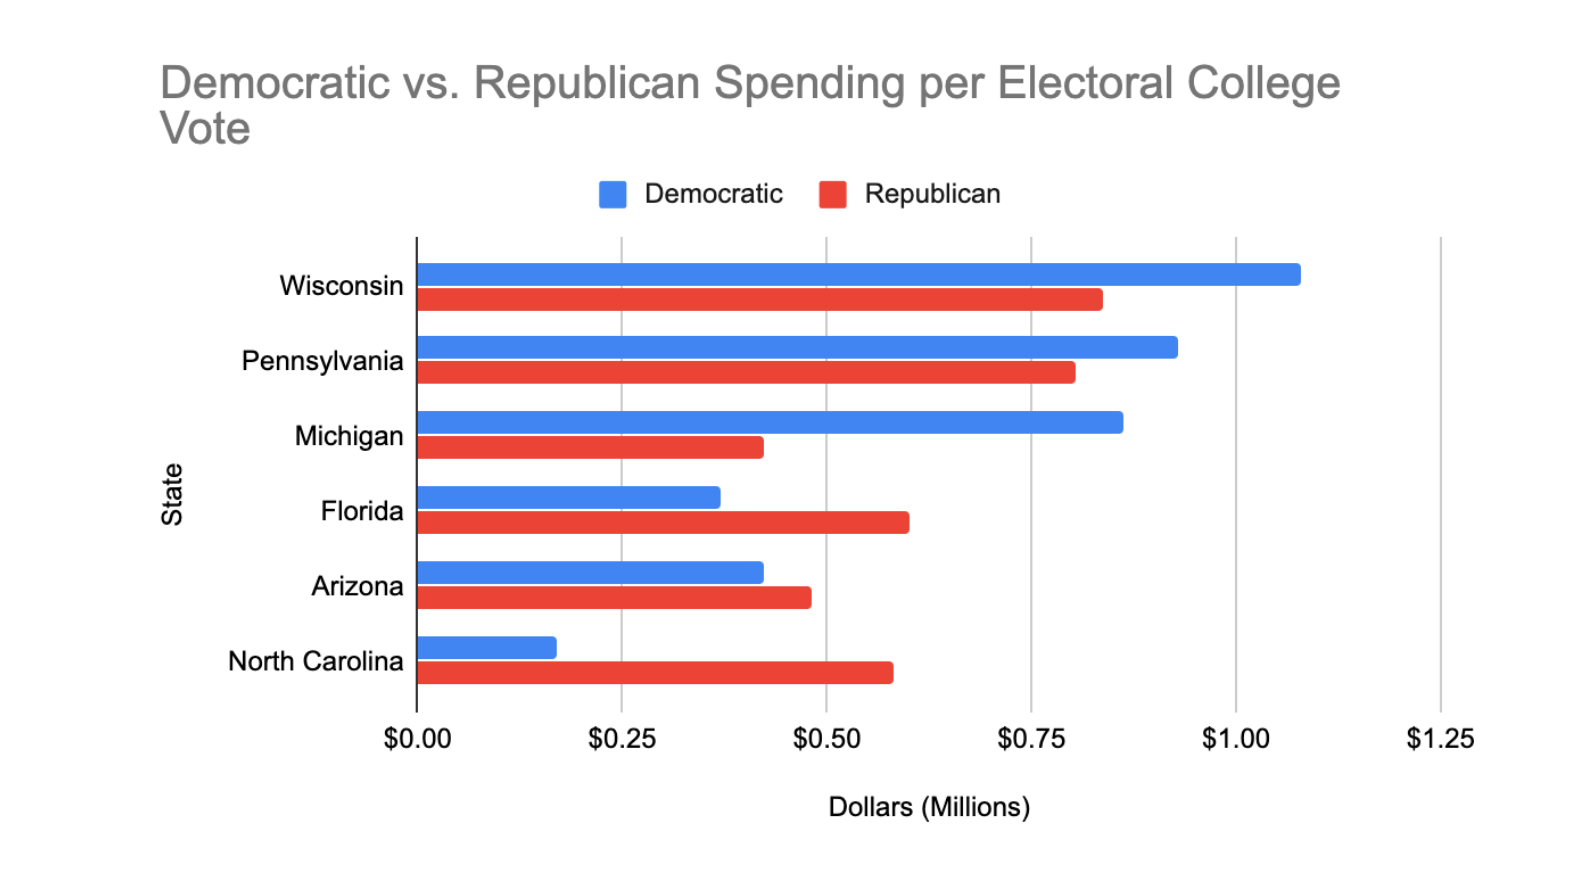
Pennsylvania, Florida, Michigan, Wisconsin, North Carolina, and Arizona all drew significant attention with the most money spent in Pennsylvania ($35 million overall with $27 million on local broadcast TV). All of these states are, of course, important and important in different ways to each of the campaigns. Although mathematically possible, it’s hard to see how President Trump is re-elected if he does not win Florida and North Carolina. And, for Biden, it is hard to see how he gets to 270 without Pennsylvania and Michigan. And, again, although mathematically possible to win without the Badger State, Wisconsin is crucial to the electoral college vote calculus of both campaigns.
An excellent way to compare the importance of a state and the weight of advertising messages that are hitting its voters is to divide the dollars spent in a state by the number of Electoral College votes that a state has. This corrects for the simple fact that large states have more people and are more expensive to advertise in. On an advertising-dollars-per-Electoral-College-Vote basis, Wisconsin led the list followed by Pennsylvania, Michigan, Florida, Arizona, and North Carolina. We’ll continue to track this over the course of the campaign.
For the first time, we are also now not only able to track digital spending, but with important platforms such as Facebook, we are able to see where that spending is being geographically targeted. And, although we do see digital advertising dollars aimed at states that would be decisive, we also see significant spending in California, New York, and Texas. In the case of the first two, those advertising investments are clearly meant to raise more money. That is likely the case in Texas as well, but we’ll pay attention to whether we see dollars flowing to local television and cable outlets in the Lone Star State to gauge if it is truly being contested.